This guide will cover the basics of collecting data in the Visualize workspace of Automation1 Studio (i.e. how to configure signals and collect specific moves or portions of a program).
Basic Step-by-step Data Collection guide
- Open Automation1 Studio and Connect to a controller.
- Navigate to the Visualize tab.
- Once there, go to Configuration → Configure Data Collection.
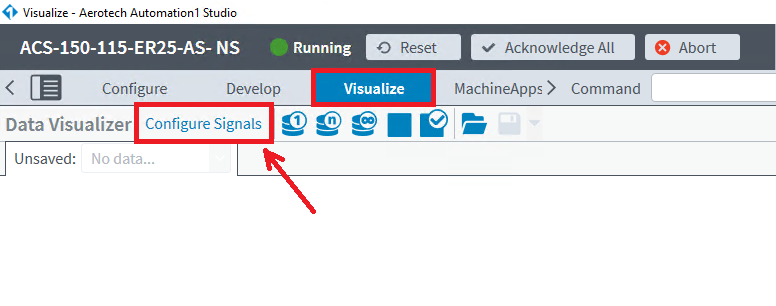
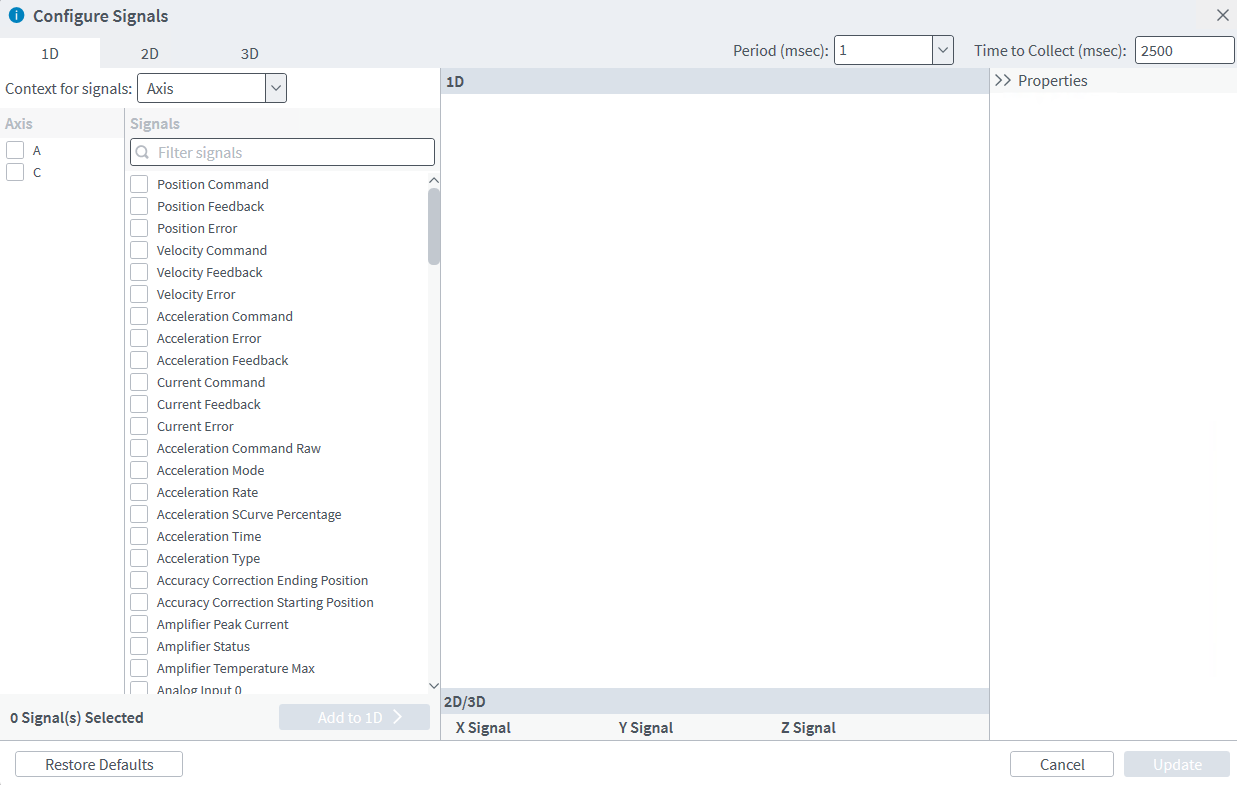
- The Configure Data Collection window will be where you configure your signals and set up how quickly data will be collected.
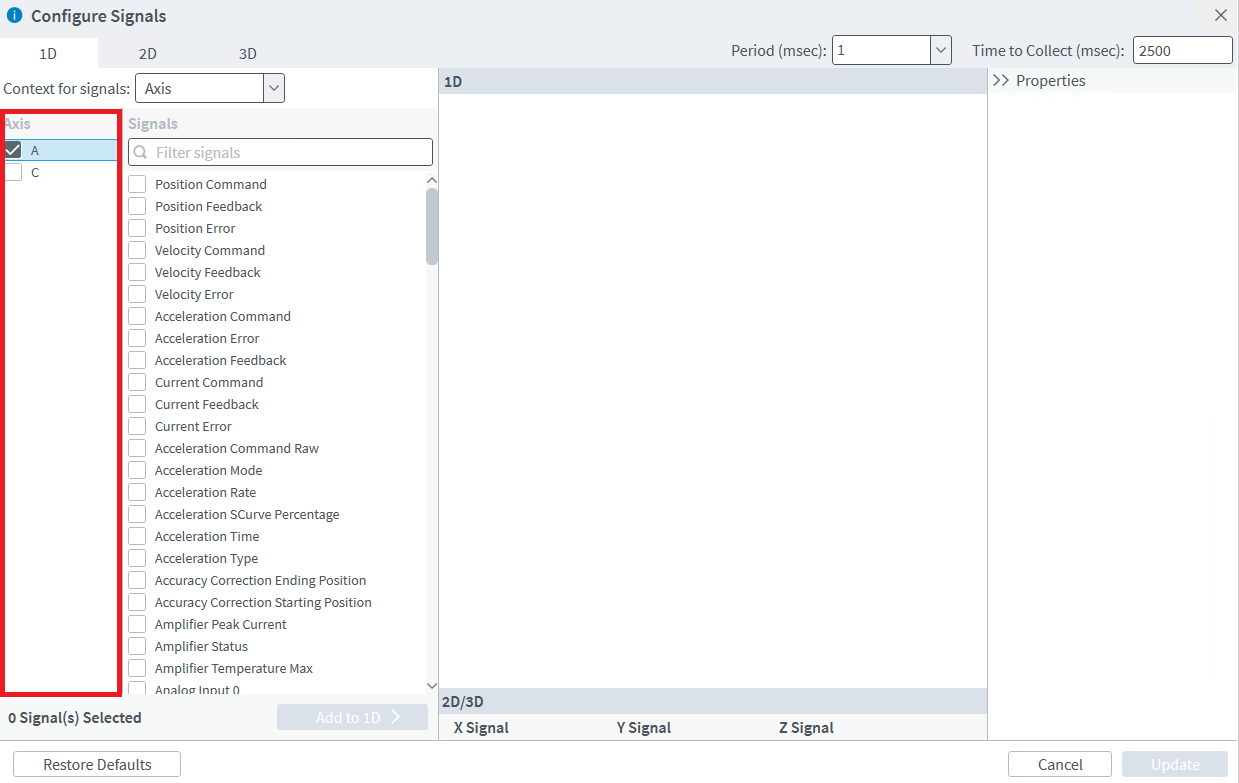
- Select your Axis from the Axis box.
- Select the axis Signals you want to view from the Signals box. To select another category of signals (System, Axis, Task, Industrial Ethernet, etc.) choose the category from the dropdown box above the data signals. The search box can be used to search for signals within the selected category.
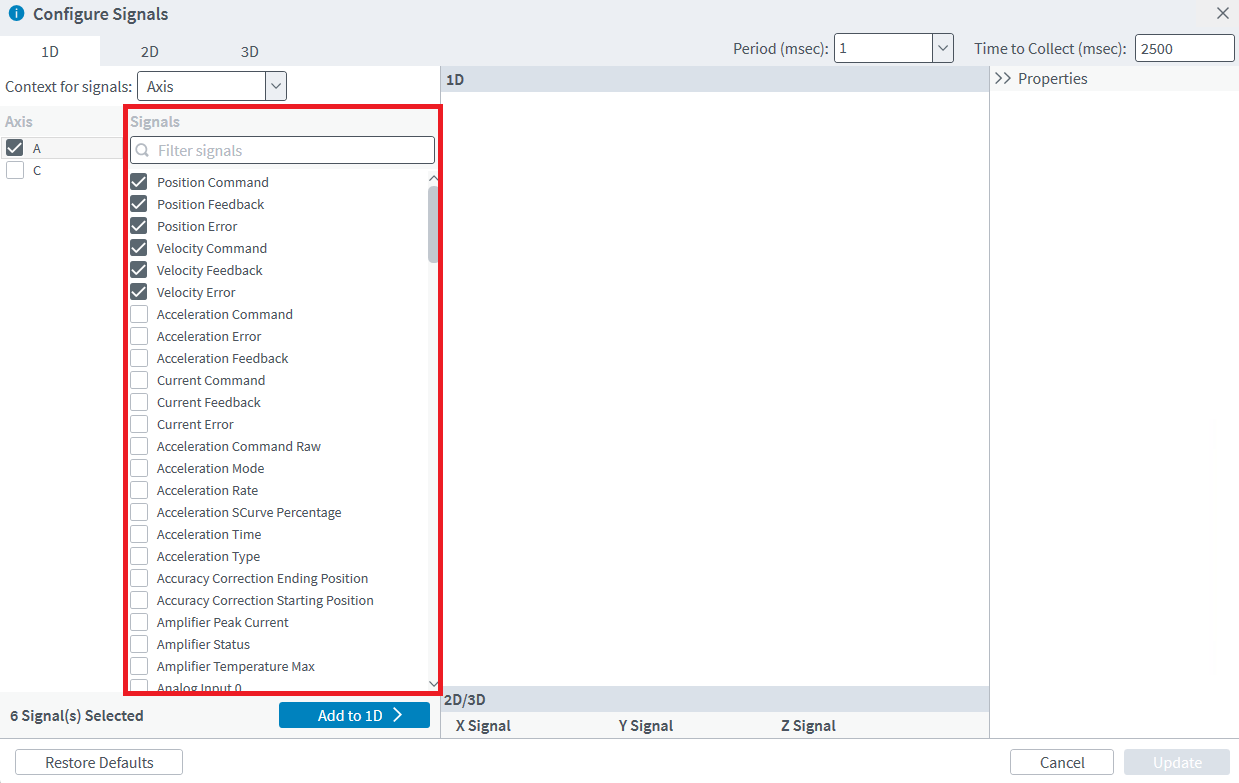
- Press the Add to ID button to add the selected data signals to the Configured Signals list.
- Set the Period (msec) = 1.000. Set the Points = 8000. The Period and the Points can be used to control how much data you will collect. With a data collection rate of 1.000 msec and 8000 points total, you will have 8 seconds worth of data. Increasing the Points to 9000 will give you 9 seconds worth of data.
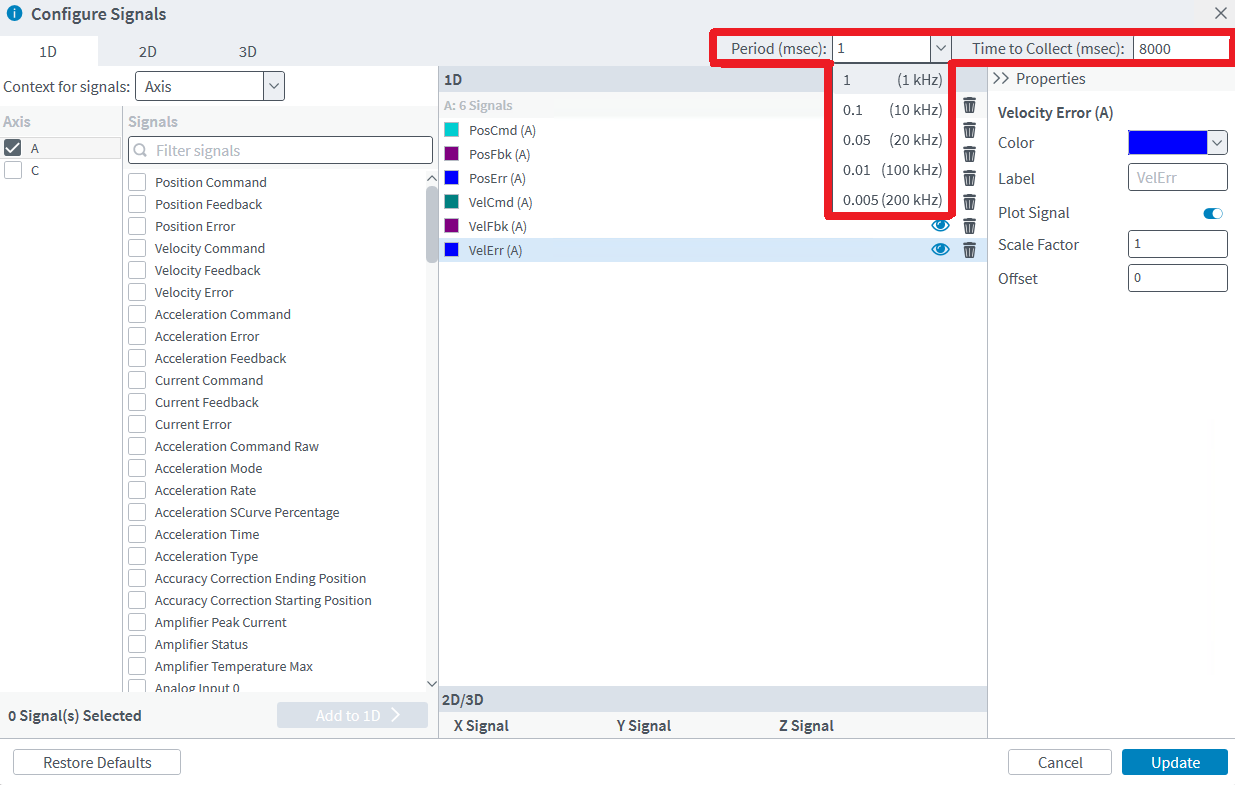
- Click the Update button to save the changes to the configuration. Automation1 is now ready to collect data. 2D and 3D signals can also be configured by selecting the 2D or 3D tab at the top of the configure window and choosing which data signals to collect.
- To collect data, there are a few options available.
- Use the collection buttons at the top of the Visualize workspace. In order, these buttons will:
- 1: Collect 1 plot of data of what the axis is currently doing. If the axis is sitting still, the plot will be of the axis sitting still. If the axis is moving, the plot will be of the axis moving.
- n: Collect repeated snapshots (plots) of what the axis is currently doing.
- infinity: Plot data continuously of what the axis is currently doing.
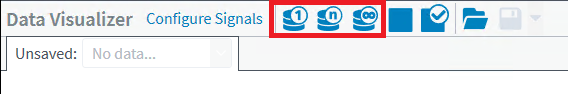
- Use the AppDataCollectionSnapshot() command in a program to trigger data collection in the Visualize tab.
- Use the collection buttons at the top of the Visualize workspace. In order, these buttons will:
- When the total number of data Points have been collected the plot will be displayed. Plots can be saved as .PLT files from the Visualize tab.
Related articles